“Extraordinary claims require extraordinary evidence.” — Carl Sagan
🎧 ▶️ Press the play button below to listen.
Why the “How” Matters as Much as the “What”
In Part 1, I told you something that sounds almost unbelievable: Alzheimer’s disease may not be primarily a brain disease at all. Its genetic roots appear to lie in your immune system, your lungs, your gut—not in the memory centers of your brain.
If you’re like most people, your first reaction was probably a mix of curiosity and skepticism. “Really? How do they know that?”
That’s exactly the right reaction. And it deserves a real answer.
In this second installment, I’m taking you behind the scenes of the science. No jargon. No unnecessary technicalities. Just a clear, step-by-step walkthrough of how the researchers arrived at their conclusions—and why you can trust what they found.
Because here’s the thing: the researchers didn’t just look at the data one way and call it a day. They used three completely different methods—each like a different type of microscope—to examine the same genetic information.
They analyzed over 4.4 million individual cells from 128 different tissues. They used artificial intelligence to predict where genetic variants have their effects. And they ran test after test to make sure they weren’t being fooled by random chance.
When all three methods point to the same answer, that’s not a coincidence. That’s science at its most powerful.
So let’s dive in. By the end of this article, you’ll understand not just what the researchers found, but how they found it—and why it changes everything we thought we knew about Alzheimer’s disease.
The Genetic Detective Work: Where the Data Came From
Before any analysis could begin, the researchers needed the raw material: genetic information from hundreds of thousands of people. Think of it like a detective gathering evidence before solving a case.
The Dataset: Half a Million People
The researchers used the largest available genetic study of Alzheimer’s disease, called the EADB (European Alzheimer & Dementia Biobank) meta-analysis. This massive dataset included:
- 85,934 people with Alzheimer’s disease
- 487,511 healthy controls (people without Alzheimer’s)
That’s over half a million people. To put that in perspective, that’s roughly the population of a midsize city—all contributing their genetic information to help solve the Alzheimer’s puzzle.
With this many people, researchers can detect patterns that would be invisible in smaller studies. A genetic variant that increases Alzheimer’s risk by just a small amount might not show up in a study of 1,000 people. But in half a million people? Those tiny signals become crystal clear.
What They Were Looking For
The researchers weren’t looking at every single genetic difference between people. Instead, they focused on genome-wide significant variants—specific locations in the DNA where differences are strongly associated with Alzheimer’s risk.
Think of these variants as genetic “signals” that tell scientists, “Something important is happening here.”
For their main analysis, they identified 148 independent genetic variants strongly linked to Alzheimer’s. These are the breadcrumbs that would lead them to the tissues and cells where Alzheimer’s risk actually operates.
The “What If” Tests
Good scientists don’t just find a pattern and stop. They ask: “What if this pattern is being driven by something else?”
The researchers ran several “what if” tests:
- What if APOE is driving everything? APOE is the most famous Alzheimer’s risk gene. The researchers repeated all their analyses after removing the APOE region from the data. The pattern held.
- What if we’re using too strict a threshold? The main analysis used the gold-standard significance threshold (p ≤ 5×10⁻⁸). They repeated everything with a lower, more permissive threshold to catch weaker signals. The pattern held.
- What if the gene mapping is wrong? They used four different methods to assign genes to genetic variants. All four produced the same overall pattern.
When a finding survives these “what if” tests, scientists gain confidence that it’s real—not a statistical fluke or a methodological artifact.
Three Ways to Look at the Same Question
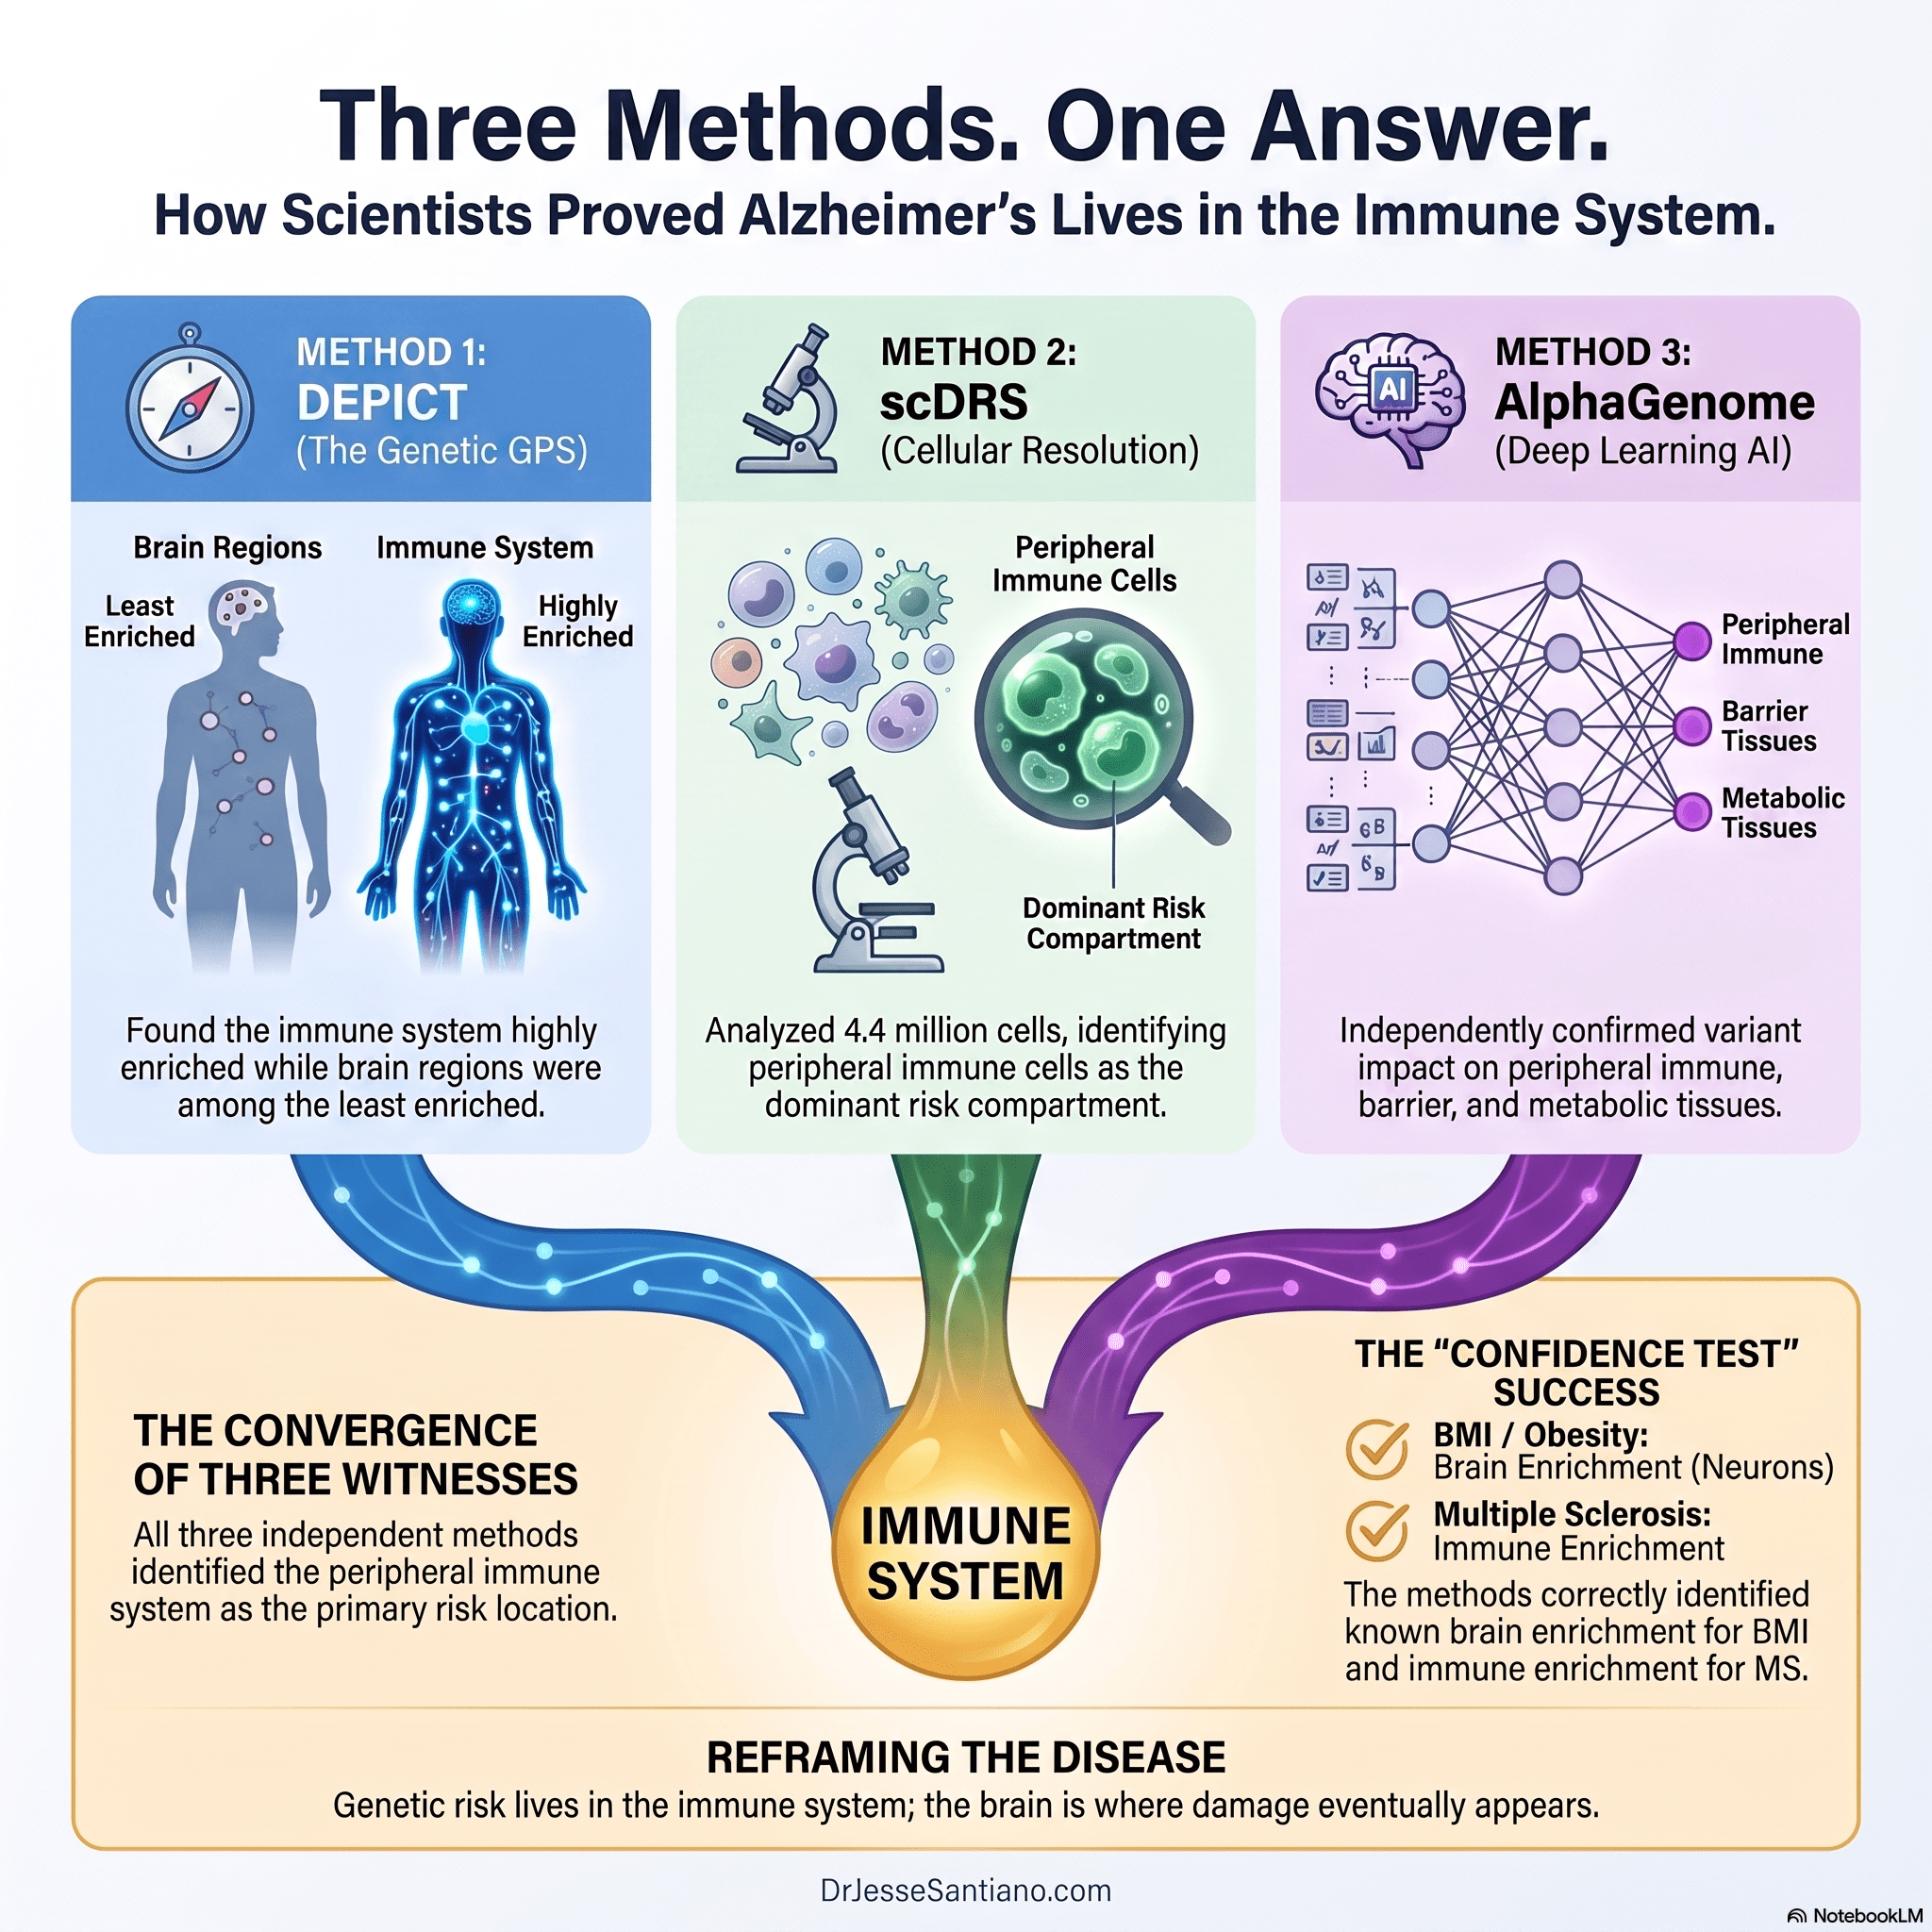
Here’s where the science gets clever. The researchers didn’t just use one method to analyze the data. They used three completely different methods—each with different strengths and weaknesses. If all three pointed to the same answer, they’d know they were onto something real.
Think of it like this: if you want to know whether a building is structurally sound, you don’t just look at it from one angle. You walk around it. You examine the foundation. You check the blueprints. You test the materials. Each method gives you a different piece of the puzzle, and when they all agree, you can be confident in your conclusion.
Method #1: DEPICT – Following the Genetic Breadcrumbs
What it does: DEPICT is like a genetic GPS system. You give it the locations of Alzheimer’s risk variants, and it tells you which tissues in the body those variants are most likely affecting.
How it works (in plain English):
- Genes work together in teams. When a gene is active in a particular tissue (say, the liver), it often brings along “partner” genes that do similar jobs.
- DEPICT looks for these teams. If Alzheimer’s risk variants cluster around genes that are all active in the immune system, DEPICT says, “Aha! The immune system is probably important here.”
- It tests every tissue in the body. The researchers fed DEPICT data from hundreds of different tissues—everything from brain regions to blood to the digestive tract—and asked which ones showed the strongest connection to Alzheimer’s genetic risk.
What it found: The strongest signals mapped to the immune system: monocytes, macrophages, dendritic cells, blood, and bone marrow.
The cortex and hippocampus—the brain regions most affected by Alzheimer’s—ranked among the least enriched tissues.
Why this method matters: DEPICT works at the tissue level—it can tell you that “the lung” or “the blood” is enriched for Alzheimer’s genes. But it can’t tell you which specific cell types are involved. That’s where the next method comes in.
Method #2: scDRS – Zooming in on Individual Cells
What it does: If DEPICT is like looking at a city from an airplane, scDRS is like zooming in to see individual buildings—in this case, individual cells. This method combines genetic data with single-cell RNA sequencing to identify exactly which cell types carry Alzheimer’s genetic risk.
The single-cell data: The researchers assembled an enormous single-cell atlas:
| Source | Cells Analyzed | Donors | Tissues Covered |
|---|---|---|---|
| Tabula Sapiens | >1.1 million | 24 | 28 peripheral tissues |
| Brain Census | >3.3 million | 3 | 100 brain regions |
| Combined | >4.4 million | 27 | 128 total |
That’s over 4.4 million individual cells from 128 different tissue types. No one has ever done an Alzheimer’s genetic analysis at this resolution before.
How it works:
Step 1: Identify the top 1,000 Alzheimer’s genes.
First, the researchers used a tool called MAGMA to rank every gene in the human genome by its statistical association with Alzheimer’s disease. They took the top 1,000 genes—the ones most strongly linked to Alzheimer’s risk.
Step 2: Check where those genes are active.
Then, using the single-cell data, they looked at every one of the 4.4 million cells and asked: “Are the top 1,000 Alzheimer’s genes more active in this cell than we’d expect by chance?”
Step 3: Aggregate by cell type.
Cells that share similar functions get grouped into cell types. The researchers compared the Alzheimer’s gene activity across all cell types to identify which ones were most enriched.
What it found: The peripheral mononuclear phagocyte system—monocytes, macrophages, and dendritic cells—emerged as the dominant compartment.
Within the brain, microglia (the brain’s resident immune cells) were the only cell type showing consistent enrichment. But the strongest signals were in peripheral immune cells, not brain cells.
The Confidence Test: Why BMI and Multiple Sclerosis Matter
Before the researchers could trust what scDRS was telling them about Alzheimer’s, they needed to prove the method actually worked. So they ran a positive control—a test where they already knew the answer.
Think of it like testing a new blood test. You first test it on people you know have the disease and people you know don’t. If the test correctly identifies the sick people, you can trust it when you use it on people with unknown status.
The researchers did the exact same thing with scDRS. They ran the analysis on two diseases where the biology is already well-understood:
Positive Control #1: (High) Body Mass Index (BMI)
What we already knew: Obesity isn’t just a problem of excess fat. Its genetic roots are primarily in the brain, where genes regulate appetite, satiety, and energy balance. Studies have consistently shown that BMI-associated genetic variants are enriched in brain tissues—particularly in neurons that control feeding behavior.
What the researchers did: They applied scDRS to BMI genetic data and asked: “Where are the BMI risk genes most active?”
What they found: The method correctly identified brain enrichment. The strongest signals appeared in neurons, particularly those in the hypothalamus—the brain region that controls hunger and metabolism.
What this means: Imagine you’re looking for a lost key. You search the living room and find it exactly where you expected. That doesn’t just tell you where the key is—it tells you your search method works.
Now, to address a question you might be asking: Does this mean people with high BMI have more inflammation-related genes active?
Not directly. What the BMI positive control shows is that the genetic risk for obesity operates through brain pathways—genes that affect appetite, cravings, and energy expenditure. But obesity also causes inflammation as a downstream consequence.
The excess fat tissue itself produces inflammatory molecules. So while the genetic risk for obesity lives in the brain, the consequences of obesity include systemic inflammation.
This is actually a perfect analogy for Alzheimer’s. The BMI example shows that:
- The site of genetic risk (where the genes are active) can be different from
- The site of pathology (where the damage occurs)
For obesity, the genetic risk is in the brain, but the pathology (excess fat) is in the adipose tissue.
For Alzheimer’s, the genetic risk is in the immune system, but the pathology (plaques and tangles) is in the brain.
This distinction is crucial. It means that treating the site of pathology—removing fat for obesity, clearing plaques for Alzheimer’s—may not address the underlying genetic drivers. You have to target where the risk originates, not just where the damage appears.
Positive Control #2: Multiple Sclerosis (MS)
What we already knew: Multiple sclerosis is an autoimmune disease where the immune system mistakenly attacks the protective covering of nerve fibers in the brain and spinal cord. The genetic risk for MS is known to be immune-driven, with risk variants concentrated in genes that regulate immune cell function.
What the researchers did: They applied scDRS to MS genetic data and asked: “Where are the MS risk genes most active?”
What they found: The method correctly identified immune enrichment. The strongest signals appeared in immune cells—T cells, B cells, and myeloid cells—not in brain cells.
What this means: This is like searching for your lost key and finding it in the kitchen—exactly where you expected based on where you last used it. When the method found immune enrichment for MS (which is known to be immune-driven), the researchers knew scDRS was working correctly.
Now, to address the question you might be asking: Does this mean people with MS have more inflammation-related genes active?
Yes, but with an important distinction. People with MS have genetic variants that make their immune cells more likely to become dysregulated and attack the nervous system. These genetic variants are enriched in immune cells, meaning the genes are more active or expressed differently in those cells.
When scDRS found immune enrichment for MS, it means that the MS risk genes are predominantly active in immune cells—not brain cells. This is exactly what we’d expect based on decades of MS research, which has shown that MS is primarily an immune-mediated disease.
The key insight: For MS, the genetic risk lives in the immune system, and the pathology (nerve damage) occurs in the brain. The immune system attacks the brain. The genetic risk is in the immune cells; the damage is in the brain tissue.
Why This Matters for Alzheimer’s
Here’s where it all comes together.
When the researchers ran scDRS on Alzheimer’s, they found something striking: Alzheimer’s genetic enrichment profile looked almost identical to Multiple Sclerosis.
| Disease | Primary Genetic Enrichment | Site of Pathology |
|---|---|---|
| BMI/Obesity | Brain (neurons, hypothalamus) | Adipose tissue (fat) |
| Multiple Sclerosis | Immune system (T cells, B cells, myeloid cells) | Brain and spinal cord |
| Alzheimer’s | Immune system (monocytes, macrophages, myeloid cells) | Brain (plaques, tangles) |
For Alzheimer’s, just like MS, the genetic risk is concentrated in the immune system, not the brain. The damage occurs in the brain, but the genetic predisposition comes from immune cells.
This is a powerful finding because:
- It validates the approach. The method correctly identified immune enrichment for MS, a disease we already know is immune-driven. When it found the same pattern for Alzheimer’s, the researchers could be confident they weren’t looking at random noise.
- It reframes Alzheimer’s. Just as MS is an immune-mediated disease that affects the brain, Alzheimer’s may be an immune-mediated disease that affects the brain. The pathology is in the brain, but the etiology is in the immune system.
- It points to new prevention strategies. If Alzheimer’s is immune-driven like MS, then targeting the immune system may be more effective than targeting brain pathology alone. This is exactly what the rest of the study explored.
The Takeaway
When you read that “BMI is enriched in the brain” and “MS is enriched in the immune system,” here’s what it means in plain language:
- For BMI: The genes that increase your risk of obesity are most active in your brain—the part of you that controls appetite, cravings, and when you feel full. That’s why obesity is so hard to treat with willpower alone; your brain is literally wired to make you eat.
- For MS: The genes that increase your risk of MS are most active in your immune cells—the part of you that normally fights infections. In MS, these immune cells get confused and attack your nervous system instead.
- For Alzheimer’s: The genes that increase your risk of Alzheimer’s are most active in your immune cells—not your brain. This suggests that Alzheimer’s, like MS, may be driven by immune system dysfunction that eventually damages the brain.
The researchers ran these positive controls to prove their method worked. And when the method correctly identified the expected biology for both BMI and MS, they could trust its findings for Alzheimer’s.
This is the gold standard of scientific research: using what you already know to validate what you’re trying to discover. The BMI and MS controls are why we can be confident that Alzheimer’s genetic risk really does live in the immune system—not just in the brain.

Method #3: AlphaGenome – The Artificial Intelligence Approach
What it does: This is the most technically sophisticated method. AlphaGenome uses deep learning (a type of artificial intelligence) to predict the functional impact of genetic variants across tissues and cell types.
Why this matters: Not all genetic variants work by changing the protein a gene makes. Many work by affecting when and where a gene is turned on or off. These regulatory variants are harder to study, but AlphaGenome is designed specifically to find them.
How it works:
- The AI was trained on massive amounts of biological data. AlphaGenome learned to predict gene activity from DNA sequence alone by studying:
- RNA expression (which genes are active)
- Chromatin accessibility (how tightly DNA is packaged—tightly packaged DNA is usually inactive)
- Transcription factor binding (proteins that turn genes on or off)
- Histone modifications (chemical tags that affect gene activity)
- The researchers fed it the Alzheimer’s risk variants. For each variant, AlphaGenome predicted its regulatory impact across:
- 116 different tissues
- 106 different cell types
- 8 different types of biological data
- They ranked the results. Tissues and cell types with the highest predicted variant impact were considered most likely to be involved in Alzheimer’s risk.
What it found: AlphaGenome independently implicated peripheral immune, barrier, and metabolic tissues as the primary sites of predicted variant impact. This provided orthogonal validation—confirmation from a completely different method—of the findings from DEPICT and scDRS.
The quantile score concept: For each variant, AlphaGenome generated a quantile score—essentially a ranking of how disruptive that variant is compared to the background genome. A variant with a quantile score of 0.99 means it’s in the top 1% of most disruptive variants in that tissue. This helps researchers understand which variants are most likely to have real biological effects.
The Convergence: When Three Methods Agree
Here’s the beauty of the study design: each method has different strengths and weaknesses, but when they all point in the same direction, the conclusion is much stronger.
| Method | What It Looks At | What It Tells You | Weakness |
|---|---|---|---|
| DEPICT | Co-regulated gene networks | Which tissues are enriched | Can’t identify specific cell types |
| scDRS | Individual cell gene expression | Which cell types are enriched | Depends on healthy donor data |
| AlphaGenome | Regulatory variant impact | Which tissues/cells variants affect | Based on predictions, not direct measurement |
When all three methods independently identified the peripheral immune system and myeloid lineage cells as the primary locations of Alzheimer’s genetic risk, the researchers knew they had discovered something real—not a statistical fluke or a methodological artifact.
It’s like three different witnesses describing the same suspect. If their descriptions match, you can be confident they’re describing the same person.
The Age Discovery: How They Found the 55–60 Window
One of the most striking findings from the study was the identification of a critical midlife window—ages 55 to 60—when Alzheimer’s risk gene expression peaks in peripheral immune cells.
How did they find this?
Step 1: They looked at immune cells from 17 peripheral tissues. Using single-cell data from 12 donors across different age ranges, they examined the expression of Alzheimer’s risk genes in immune cells from tissues like blood, lung, gut, and spleen.
Step 2: They stratified by age. The donors were grouped into five age windows: 50-54, 55-60, 60-64, 65-70, and 70-74. For each age group, they calculated the average expression of Alzheimer’s risk genes across all immune cells.
Step 3: They looked for patterns. Unlike normal immune marker genes (which stayed relatively constant with age), Alzheimer’s risk genes showed a dramatic peak at 55-60—then declined.
What this means: This isn’t just random variation. It suggests that something biologically significant happens to your immune system in your mid-50s that increases Alzheimer’s susceptibility. And importantly, it happens before irreversible brain damage occurs—which means it represents a window for intervention.
The Confidence Builders: How the Researchers Tested Their Own Work
Good scientists don’t just find a pattern and publish it. They test their findings from every angle to make sure they’re real.
Positive Controls
As mentioned earlier, the researchers ran the same analyses on:
- Body Mass Index (BMI): Known to be enriched in the brain
- Multiple Sclerosis (MS): Known to be immune-driven
When their methods correctly identified the expected tissue enrichments for these positive controls, they gained confidence that their findings for Alzheimer’s were trustworthy.
Sensitivity Analyses
The researchers conducted several “what if” tests:
- Removing APOE. APOE is the strongest Alzheimer’s risk gene and is expressed in both the brain and periphery. When they removed it from the analysis, the peripheral immune enrichment pattern persisted.
- Lower significance threshold. The main analysis used genome-wide significant variants (p ≤ 5×10⁻⁸). They repeated everything with a lower threshold (p ≤ 5×10⁻⁴) to catch weaker signals. The pattern held.
- Different gene mapping approaches. They used four different methods to assign genes to genetic variants. All four produced the same overall pattern.
Replication Across Methods
Perhaps the strongest evidence is that all three methods (DEPICT, scDRS, and AlphaGenome) independently pointed to the same conclusion. This is called triangulation—when multiple independent lines of evidence converge on the same answer, you can be confident the answer is correct.
The Limitations: What We Still Don’t Know
No study is perfect, and the researchers were transparent about the limitations of their work. Here’s what they acknowledged:
1. Correlation, Not Causation
Showing that Alzheimer’s genes are active in the immune system doesn’t prove that immune system problems cause Alzheimer’s. It just shows a strong association. Proving causation requires different types of studies—experimental interventions, animal models, and clinical trials.
Why this matters: The findings point toward promising prevention strategies, but they don’t yet prove that intervening on the immune system will prevent Alzheimer’s. That’s the next step.
2. Healthy Donor Data
Most of the single-cell data came from healthy donors, not people with Alzheimer’s. Gene expression patterns might change in Alzheimer’s patients in ways not captured here.
Why this matters: The study used healthy donors to understand where Alzheimer’s risk genes are normally active. But disease itself might change gene expression patterns. The researchers partially addressed this by analyzing AD postmortem brain tissue, but these datasets were limited.
3. European Ancestry Only
The genetic data came primarily from people of European ancestry. The findings may not apply equally to all populations.
Why this matters: Alzheimer’s risk varies across populations, and genetic studies need to include diverse populations to ensure findings are broadly applicable.
4. Myeloid Cell Ambiguity
Myeloid cells exist in both the periphery and the brain (as microglia). The study showed stronger enrichment in peripheral myeloid cells, but it can’t definitively prove the effects are exclusively peripheral.
Why this matters: It’s possible that some of the enrichment in peripheral myeloid cells reflects shared biology with microglia. Future studies using more sophisticated techniques (like lineage tracing) will be needed to tease this apart.
5. The Need for Functional Studies
Enrichment analyses are inherently correlative. They identify tissues and cell types that are statistically enriched for Alzheimer’s-associated genes, but they don’t explain the underlying biological mechanisms.
Why this matters: To truly understand how these genes contribute to Alzheimer’s, researchers need to do experiments—perturbing genes in cells, studying animal models, and eventually conducting human trials. The genetic findings provide the roadmap; experimental studies will fill in the details.
Why This Changes Everything
Despite these limitations, the study represents a major paradigm shift in how we understand Alzheimer’s disease. Here’s why:
It Reframes Alzheimer’s as a Systemic Disease
For decades, we’ve treated Alzheimer’s as a brain disease. This study suggests that’s wrong. The upstream genetic determinants—the things that actually increase your risk—are primarily in your peripheral immune system and metabolism. The brain pathology is downstream: it’s the consequence, not the cause.
This is similar to how we understand obesity. Obesity looks like a problem of excess fat (the “pathology”), but its genetic roots are primarily in the brain, where genes regulate appetite and energy balance. Treating obesity by removing fat (liposuction) doesn’t address the underlying problem.
Similarly, treating Alzheimer’s by clearing amyloid plaques may not address the underlying systemic dysregulation.
It Identifies a Window of Opportunity
The 55–60 age window suggests that Alzheimer’s prevention may be most effective in midlife—before the brain has sustained irreversible damage. This is a huge shift from current approaches, which typically start after symptoms appear.
It Points Toward New Prevention Strategies
If Alzheimer’s is driven by peripheral immune and metabolic dysregulation, then prevention strategies should target those systems. This validates lifestyle interventions—diet, exercise, sleep, stress management—that support immune and metabolic health. It also suggests new therapeutic targets, like modulating the immune system or gut microbiome.
It Explains Why Amyloid-Targeting Drugs Have Been Disappointing
If amyloid is a downstream consequence of systemic immune and metabolic dysregulation, then clearing amyloid without addressing the underlying cause would be like mopping up water while leaving the faucet running. This helps explain why drugs that clear amyloid plaques offer minimal cognitive benefit.
The Road Ahead: What Needs to Happen Next
The study is a powerful first step, but it’s not the final word. Here’s what needs to happen next:
- Functional studies. Researchers need to experimentally perturb the genes identified in this study to understand their biological mechanisms.
- Disease-contextualized datasets. Studies need to look at gene expression in people with Alzheimer’s, at different disease stages, to understand how gene expression changes over time.
- Diverse populations. Similar analyses need to be conducted in non-European populations to ensure the findings are broadly applicable.
- Clinical trials. Prevention strategies based on these findings need to be tested in clinical trials, starting with the 55–60 age window.
- Longitudinal studies. Studies need to track people from midlife through old age to understand the temporal relationship between peripheral immune dysregulation and brain pathology.
Conclusion: Trust the Science, Act on the Knowledge
I’ve taken you through a lot of science in this article. But here’s the bottom line:
The researchers analyzed genetic data from over half a million people. They examined gene expression in over 4.4 million individual cells from 128 different tissues. They used three completely different methods—DEPICT, scDRS, and AlphaGenome—to look at the same question from different angles. They ran test after test to make sure their findings were real. And every single time, the answer was the same:
Alzheimer’s genetic risk is primarily concentrated in the peripheral immune system, not the brain.
This is not a speculative hypothesis. It’s a robust, replicated finding from one of the most comprehensive genetic analyses ever conducted on Alzheimer’s disease.
Does this mean we have a cure? No. Does it mean we can prevent Alzheimer’s with absolute certainty? Not yet. But it does mean we now know where to look—and when to act.
The 55–60 window is the moment when your immune system’s Alzheimer’s-related genes become most active. It’s the moment before irreversible brain damage begins. It’s the moment when prevention is still possible.
So what do you do with this knowledge?
You act. You support your immune system. You protect your lungs and gut. You manage your metabolic health. You get comprehensive health assessments in your 50s. You build sustainable health habits for the long haul.
Because the science is clear: Alzheimer’s prevention is not about waiting and hoping. It’s about understanding the biology and acting on that knowledge.
The choice is yours. The science has given you the roadmap. Now it’s time to drive.
A Note About This Research
This article is based on a preprint—research that has not yet undergone final peer review—titled “Genomic partitioning of Alzheimer’s disease in humans reveals non-CNS etiology” (Cunha et al., February 2026). The findings are preliminary and will require replication and further study.
However, the research represents a significant shift in how scientists understand Alzheimer’s etiology and provides a compelling framework for prevention strategies. As always, consult with healthcare professionals before making significant changes to your health regimen.
Read Part 1: The Alzheimer’s Prevention Revolution: Why Your Immune System—Not Just Your Brain—Holds the Key
“The best time to prevent Alzheimer’s was twenty years ago. The second best time is right now.”
Don’t Get Sick!
About Dr. Jesse Santiano, MD
Dr. Santiano is a retired internist and emergency physician with extensive clinical experience in metabolic health, cardiovascular prevention, and lifestyle medicine. He reviews all medical content on this site to ensure accuracy, clarity, and safe application for readers. This article is for educational purposes and is not a substitute for personal medical care.
💡 Support This Work
Creating well-researched articles, maintaining this website, and keeping the information free takes time and resources.
If you found this article helpful, please consider donating to support the mission of empowering people to live healthier, longer lives, without relying on medications.
🙏 Every contribution, big or small, truly makes a difference. Thank you for your support!
Follow me on Facebook, Gab, Twitter (formerly known as X), Instagram, and Telegram.
Related:
- COVID shots, Parkinson’s disease and Lewy body dementia
- The Projected Rise in Global Dementia
- 6 Ways to Lower Your Dementia Risk
- Sleeping on Your Side can Prevent Dementia
- 8 Ways Decent Dental Care Defies Dementia
- Cardiorespiratory Fitness as a Key to Preventing Dementia
- Sleep’s Hidden Power: Glymphatics Shield Your Brain From Dementia
- Risk Factors ng Alzheimer’s Dementia: Nagsisimula sa Early Age
References:
- Cunha, C., Romero-Lado, M. J., Pielies Avelli, M., Sanz Martínez, R., Belanich, J. R., Jones, T. R., Claussnitzer, M., Loos, R. J. F., & Kilpeläinen, T. O. (2026). Genomic partitioning of Alzheimer’s disease in humans reveals non-CNS etiology. medRxiv. https://doi.org/10.64898/2026.02.09.26344392
- Bellenguez, C., Küçükali, F., Jansen, I. E., et al. (2022). New insights into the genetic etiology of Alzheimer’s disease and related dementias. Nature Genetics, 54, 412–436. https://www.nature.com/articles/s41588-022-01024-z
Disclaimer:
This article is for educational purposes and is not a substitute for professional medical advice, diagnosis, or treatment. Always consult your physician before making health decisions based on the TyG Index or other biomarkers.
© 2018 – 2026 Asclepiades Medicine, LLC. All Rights Reserved
DrJesseSantiano.com does not provide medical advice, diagnosis, or treatment
As an Amazon Associate, I earn from qualifying purchases
Discover more from Don't Get Sick!
Subscribe to get the latest posts sent to your email.